Your cart is currently empty!
Sats/Joule Redux
We’ve been throwing up a sats/joule calculation from time to time, now that 15 years have passed we can put a plot or two to show how this exercise has evolved over time . Without further ado:
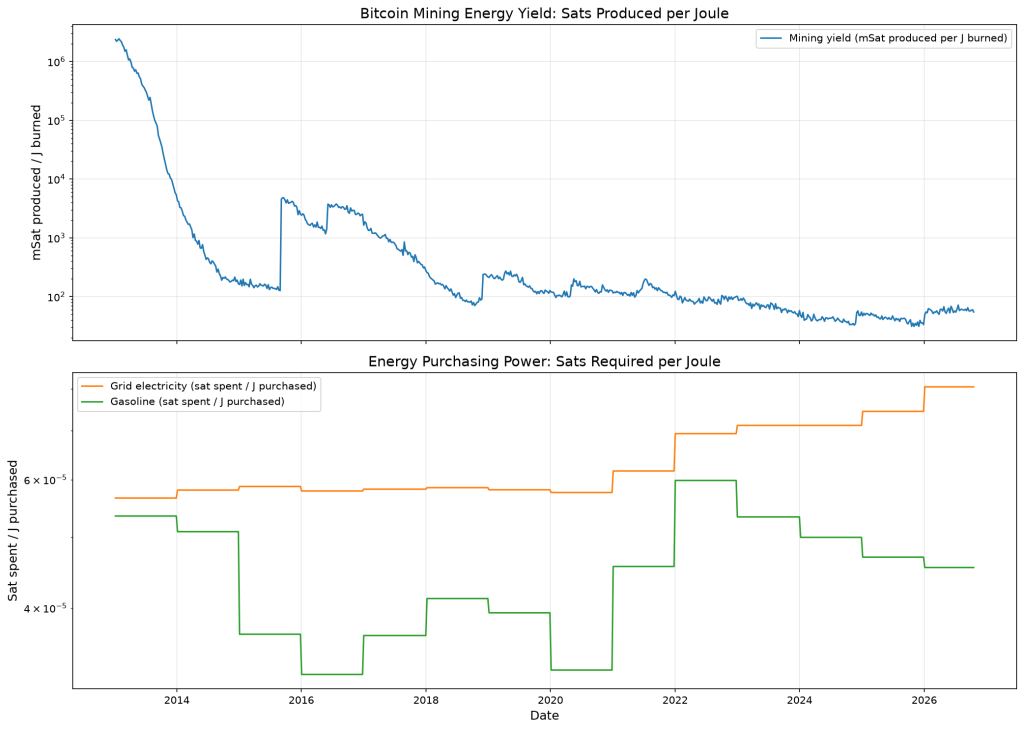
The top panel shows the bitcoin (BTC) sats/Joule as calculated by the amount of sats produced in mining using a Joule, the bottom panel shows the sats/Joule as calculated by the amount of sats used to purchase a Joule of energy as gas or electricity.
Finally, we give you the ratio of the sats/Joule determined from the top plot divided by the average of the numbers in the bottom plot:
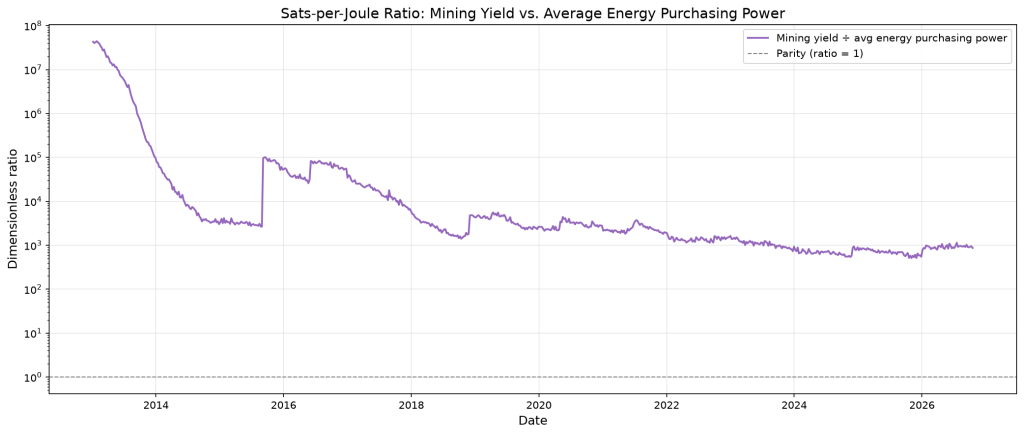
Please do notice the top panel of the first chart is in mSat/Joule. As you can tell from the bottom plot the ratio between going one way (sats-joule) and the other (joule-sats) has been hovering around 万 for a while.
Finally, here’s some python code to generate the plots, in case you are curious:
"""
satsJ.py — Historical Bitcoin sats-per-joule analysis.

Produces:
  1. Mining yield (sats produced per joule burned)
  2. Energy purchasing power (sats required per joule bought, grid + gasoline)
  3. Dimensionless ratio: mining yield / average purchasing power

Data sources:
  - Blockchain.com Charts API (hashrate)        [free, no key]
  - CoinGecko API (BTC price)                   [free, no key]
  - EIA historical tables (electricity, gas)    [hardcoded fallback]
"""

import os
import time
from datetime import datetime

import numpy as np
import pandas as pd
import requests
import matplotlib.pyplot as plt

# ============================================================
# 1. CONFIGURATION
# ============================================================
CACHE_DIR = "cache"
os.makedirs(CACHE_DIR, exist_ok=True)

BLOCKCHAIN_API = "https://api.blockchain.info/charts"
COINGECKO_API = "https://api.coingecko.com/api/v3"

# Network constants (post-April-2024 halving)
BLOCK_REWARD_SATS = 312_500_000       # 3.125 BTC
BLOCK_INTERVAL_SECONDS = 600          # 10-minute target
SATS_PER_BTC = 100_000_000

# Energy unit conversions
J_PER_KWH = 3.6e6
J_PER_GALLON_GASOLINE = 132_000_000   # ~132 MJ/gallon

# Hardware efficiency anchors (J/TH) — best commercially available ASIC
# Sources: minerstat, Glassnode, academic tables
EFFICIENCY_ANCHORS = {
    "2013-01-01": 10000,   # early ASICs (rough order of magnitude)
    "2015-09-01": 273,     # Antminer S7
    "2016-06-01": 98,      # Antminer S9
    "2017-01-01": 126,     # Antminer T9
    "2018-12-01": 57,      # Antminer S15
    "2019-04-01": 45,      # Antminer S17
    "2020-05-01": 29.5,    # Antminer S19 Pro
    "2022-10-01": 20.8,    # Antminer S19 XP Hyd
    "2024-12-01": 13.5,    # Antminer S21 XP
    "2026-01-01": 9.5,     # Antminer S23 Hyd
}

# ============================================================
# 2. DATA FETCHERS (CSV cache — no parquet dependency)
# ============================================================
def _cache_path(name):
    return os.path.join(CACHE_DIR, f"{name}.csv")

def _load_cache(name):
    path = _cache_path(name)
    if os.path.exists(path):
        return pd.read_csv(path, index_col=0, parse_dates=True)
    return None

def _save_cache(name, df):
    df.to_csv(_cache_path(name))


def fetch_blockchain_chart(chart_name, timespan="all"):
    """Fetch a historical chart from Blockchain.com's free API."""
    cache_name = f"bc_{chart_name}_{timespan}"
    cached = _load_cache(cache_name)
    if cached is not None:
        print(f"  [cache] {chart_name}")
        return cached

    url = f"{BLOCKCHAIN_API}/{chart_name}"
    params = {"timespan": timespan, "format": "json"}
    resp = requests.get(url, params=params, timeout=30)
    resp.raise_for_status()
    data = resp.json()

    df = pd.DataFrame(data["values"])
    df["date"] = pd.to_datetime(df["x"], unit="s")
    df = df.set_index("date")[["y"]].rename(columns={"y": chart_name})
    _save_cache(cache_name, df)
    time.sleep(0.5)
    return df


def fetch_bitcoin_price():
    """Fetch historical BTC price from CoinGecko (free tier)."""
    cache_name = "btc_price"
    cached = _load_cache(cache_name)
    if cached is not None:
        print("  [cache] BTC price")
        return cached

    url = f"{COINGECKO_API}/coins/bitcoin/market_chart"
    params = {"vs_currency": "usd", "days": "max", "interval": "daily"}
    resp = requests.get(url, params=params, timeout=30)
    resp.raise_for_status()
    data = resp.json()

    prices = pd.DataFrame(data["prices"], columns=["timestamp", "price"])
    prices["date"] = pd.to_datetime(prices["timestamp"], unit="ms")
    prices = prices.set_index("date")[["price"]]
    _save_cache(cache_name, prices)
    return prices


def fetch_electricity_price():
    """US average retail electricity price (USD/kWh), annual averages."""
    cache_name = "electricity_price"
    cached = _load_cache(cache_name)
    if cached is not None:
        return cached

    data = {
        "2013-01-01": 0.1019, "2014-01-01": 0.1045, "2015-01-01": 0.1057,
        "2016-01-01": 0.1042, "2017-01-01": 0.1048, "2018-01-01": 0.1053,
        "2019-01-01": 0.1046, "2020-01-01": 0.1037, "2021-01-01": 0.1110,
        "2022-01-01": 0.1249, "2023-01-01": 0.1282, "2024-01-01": 0.1282,
        "2025-01-01": 0.1340, "2026-01-01": 0.1448,
    }
    df = pd.DataFrame(
        list(data.items()), columns=["date", "price_kwh"]
    ).set_index("date")
    df.index = pd.to_datetime(df.index)
    _save_cache(cache_name, df)
    return df


def fetch_gasoline_price():
    """US regular gasoline retail price (USD/gallon), annual averages."""
    cache_name = "gasoline_price"
    cached = _load_cache(cache_name)
    if cached is not None:
        return cached

    data = {
        "2013-01-01": 3.53, "2014-01-01": 3.36, "2015-01-01": 2.43,
        "2016-01-01": 2.14, "2017-01-01": 2.42, "2018-01-01": 2.72,
        "2019-01-01": 2.60, "2020-01-01": 2.17, "2021-01-01": 3.01,
        "2022-01-01": 3.95, "2023-01-01": 3.52, "2024-01-01": 3.30,
        "2025-01-01": 3.10, "2026-01-01": 3.00,
    }
    df = pd.DataFrame(
        list(data.items()), columns=["date", "price_gal"]
    ).set_index("date")
    df.index = pd.to_datetime(df.index)
    _save_cache(cache_name, df)
    return df


# ============================================================
# 3. HARDWARE EFFICIENCY INTERPOLATION
# ============================================================
def build_efficiency_series(date_index):
    """Step-interpolate hardware efficiency (J/TH) across a date index."""
    anchor_dates = pd.to_datetime(list(EFFICIENCY_ANCHORS.keys()))
    anchor_values = list(EFFICIENCY_ANCHORS.values())

    efficiency = pd.Series(index=date_index, dtype=float)
    for i, (d, v) in enumerate(zip(anchor_dates, anchor_values)):
        if i == len(anchor_dates) - 1:
            mask = date_index >= d
        else:
            mask = (date_index >= d) & (date_index < anchor_dates[i + 1])
        efficiency[mask] = v

    return efficiency.bfill().ffill()


# ============================================================
# 4. CORE CALCULATIONS
# ============================================================
def compute_mining_yield(hashes_per_second, efficiency_j_th):
    """Sats produced per joule of mining energy (sat/J)."""
    th_per_second = hashes_per_second / 1e12
    power_watts = th_per_second * efficiency_j_th      # J/s
    sats_per_second = BLOCK_REWARD_SATS / BLOCK_INTERVAL_SECONDS
    return sats_per_second / power_watts


def compute_energy_purchasing_power(btc_price, energy_price_usd, joules_per_unit):
    """Sats required to purchase one joule of energy (sat/J)."""
    usd_per_joule = energy_price_usd / joules_per_unit
    sats_per_usd = SATS_PER_BTC / btc_price
    return usd_per_joule * sats_per_usd


# ============================================================
# 5. MAIN PIPELINE
# ============================================================
def main():
    print("Fetching network data...")

    hashrate_df = fetch_blockchain_chart("hash-rate", timespan="all")
    hashrate_df = hashrate_df.resample("W").mean().dropna()
    print(f"  Hashrate: {len(hashrate_df)} weekly points "
          f"from {hashrate_df.index[0].date()} to {hashrate_df.index[-1].date()}")

    try:
        price_df = fetch_bitcoin_price()
        price_df = price_df.resample("W").last().dropna()
        print(f"  BTC price: {len(price_df)} weekly points")
    except Exception as e:
        print(f"  BTC price fetch failed: {e}")
        price_df = None

    start_date = pd.Timestamp("2013-01-01")
    date_index = hashrate_df.index[hashrate_df.index >= start_date]

    print("Building hardware efficiency series...")
    efficiency_series = build_efficiency_series(date_index)

    print("Computing mining yield...")
    raw_hashrate = hashrate_df["hash-rate"].reindex(date_index)
    # Blockchain.com returns hash-rate in GH/s
    hashes_per_second = raw_hashrate * 1e9
    mining_yield = compute_mining_yield(hashes_per_second, efficiency_series)

    print("Computing energy purchasing power...")
    elec_df = fetch_electricity_price().reindex(date_index, method="ffill")
    gas_df = fetch_gasoline_price().reindex(date_index, method="ffill")

    if price_df is not None:
        btc_price = price_df["price"].reindex(date_index, method="ffill")
    else:
        btc_price = pd.Series(50000, index=date_index)

    elec_sats_per_joule = compute_energy_purchasing_power(
        btc_price, elec_df["price_kwh"], J_PER_KWH
    )
    gas_sats_per_joule = compute_energy_purchasing_power(
        btc_price, gas_df["price_gal"], J_PER_GALLON_GASOLINE
    )

    # ============================================================
    # 6. PLOT 1 & 2: MINING YIELD AND PURCHASING POWER
    # ============================================================
    print("Generating plots...")

    fig, axes = plt.subplots(2, 1, figsize=(14, 10), sharex=True)

    # --- Panel 1: mining yield ---
    ax1 = axes[0]
    ax1.plot(mining_yield.index, mining_yield.values * 1000,
             color="#1f77b4", linewidth=1.5,
             label="Mining yield (mSat produced per J burned)")
    ax1.set_ylabel("mSat produced / J burned", fontsize=12)
    ax1.set_title("Bitcoin Mining Energy Yield: Sats Produced per Joule",
                  fontsize=14)
    ax1.set_yscale("log")
    ax1.grid(True, alpha=0.3)
    ax1.legend()

    # --- Panel 2: purchasing power ---
    ax2 = axes[1]
    ax2.plot(elec_sats_per_joule.index, elec_sats_per_joule.values,
             color="#ff7f0e", linewidth=1.5,
             label="Grid electricity (sat spent / J purchased)")
    ax2.plot(gas_sats_per_joule.index, gas_sats_per_joule.values,
             color="#2ca02c", linewidth=1.5,
             label="Gasoline (sat spent / J purchased)")
    ax2.set_ylabel("Sat spent / J purchased", fontsize=12)
    ax2.set_xlabel("Date", fontsize=12)
    ax2.set_title("Energy Purchasing Power: Sats Required per Joule",
                  fontsize=14)
    ax2.set_yscale("log")
    ax2.grid(True, alpha=0.3)
    ax2.legend()

    plt.tight_layout()
    plt.savefig("sats_per_joule_history.png", dpi=150, bbox_inches="tight")
    print("Saved: sats_per_joule_history.png")

    # ============================================================
    # 7. PLOT 3: DIMENSIONLESS RATIO
    # ============================================================
    combined = pd.DataFrame({
        "mining_yield": mining_yield,
        "elec": elec_sats_per_joule,
        "gas": gas_sats_per_joule,
    }).dropna()

    avg_purchasing_power = combined[["elec", "gas"]].mean(axis=1)
    ratio = combined["mining_yield"] / avg_purchasing_power

    fig2, ax3 = plt.subplots(figsize=(14, 6))
    ax3.plot(ratio.index, ratio.values, color="#9467bd", linewidth=1.8,
             label="Mining yield ÷ avg energy purchasing power")
    ax3.axhline(1.0, color="gray", linestyle="--", linewidth=1,
                label="Parity (ratio = 1)")
    ax3.set_ylabel("Dimensionless ratio", fontsize=12)
    ax3.set_xlabel("Date", fontsize=12)
    ax3.set_title(
        "Sats-per-Joule Ratio: Mining Yield vs. Average Energy Purchasing Power",
        fontsize=14,
    )
    ax3.set_yscale("log")
    ax3.grid(True, alpha=0.3)
    ax3.legend()

    plt.tight_layout()
    plt.savefig("sats_per_joule_ratio.png", dpi=150, bbox_inches="tight")
    print("Saved: sats_per_joule_ratio.png")
    plt.show()

    # ============================================================
    # 8. CSV EXPORT
    # ============================================================
    output_df = pd.DataFrame({
        "mining_yield_mSat_per_J": mining_yield * 1000,
        "elec_sats_per_J": elec_sats_per_joule,
        "gas_sats_per_J": gas_sats_per_joule,
        "avg_purchasing_power_sat_per_J": avg_purchasing_power,
        "ratio_mining_over_purchasing": ratio,
        "efficiency_J_per_TH": efficiency_series,
        "btc_price_usd": btc_price,
    })
    output_df.to_csv("sats_per_joule_data.csv")
    print("Saved: sats_per_joule_data.csv")


if __name__ == "__main__":
    main()
Leave a Reply